


GBP/USD WEEKLY FORECAST FOR MARCH 11, 2024 TO MARCH 15, 2024


Posted on March 10, 2024 by imxoxo.eth
Table of Contents
GBP/USD Weekly Forecast – Recap
Last week, the GBPUSD pair broke above the daily range, after the price pushed above the 1.27787 resistance level, which was previously acting as a barrier. Looking at the long-term trend, the GBP is showing strength, and the recommended strategy is to buy when the price dips, as long as it remains above the 1.27787 resistance level.

GBP/USD Weekly Forecast – Overview
Typically, after a breakout like this, a pullback occurs before further bullish continuation. By using the Fibonacci extension, we can confirm that the next level of resistance is located at the 0.6 Fibonacci level, which is at 1.30132 and is above the 1.29946 marked on the chart. If this level is broken, it will take us to the next Fibonacci extension at 0.786, which is at 1.31467.

GBP/USD Weekly Forecast – Strategy
As mentioned previously, the GBPUSD pair concluded the week by breaking through a resistance level. Additionally, the Relative Strength Index (RSI) is currently above 80, which suggests a state of overbought. In light of these factors, I anticipate a retracement to the Fibonacci level of 0.382 at 1.28257 before considering a purchasing position.


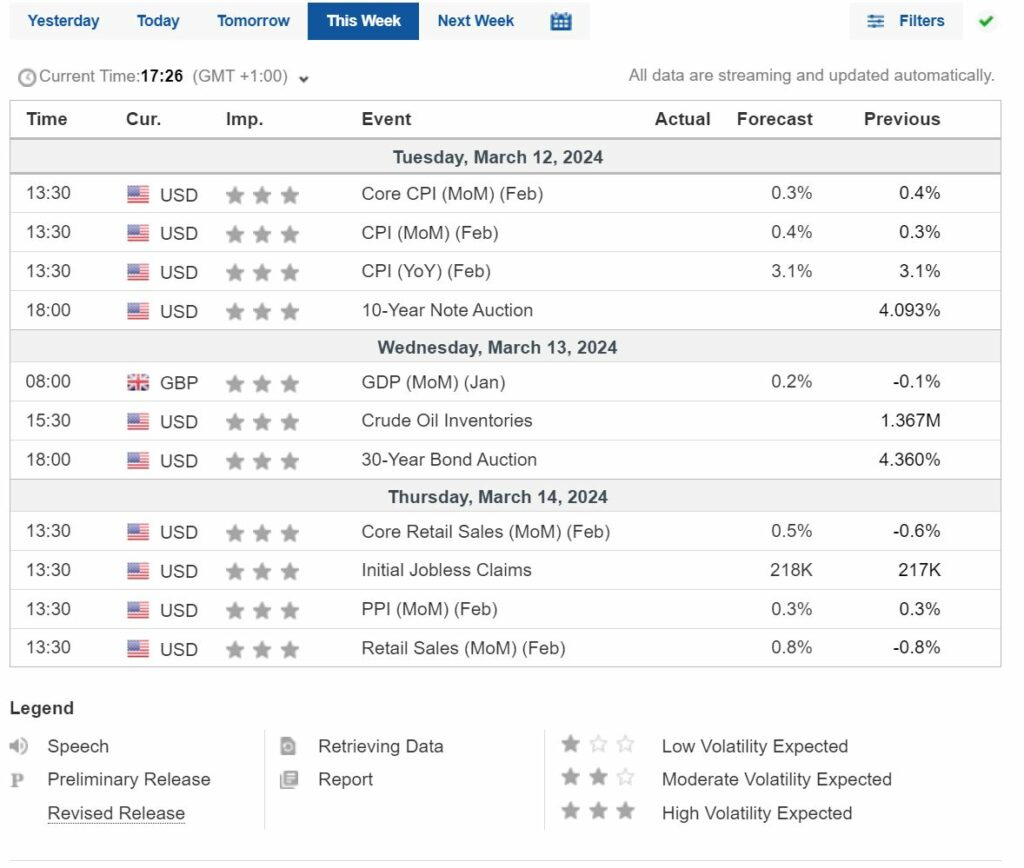
GBP/USD Weekly Forecast – Week Economic Calendar
Join the XOXOTRADER FX VIP Room to have real-time alerts on this trade.